 0
0
TopGen
and TopAnalysis
In the paper "Improved
Tradeoff-based Models of the Internet" we used
two programs, TopGen and TopAnalysis, to generate and
analyze
internet
topologies. Here we make both
available.
@inproceedings{spatharis_07,
  author= {Antonis Spatharis and Ilias Foudalis and Minas Gjoka and Panagiota Krouska and Christos Amanatidis and  Christos H. Papadimitriou and Martha Sideri},
  title= {{Improved Tradeoff-based Models of the Internet}},
  booktitle = {Proceedings of the SIWN/IEEE International Conference on Complex Open Distributed Systems (CODS '07)},
  address = {Chengdu, China},
  month = {July},
  year = {2007}
}
WHAT ARE TOPGEN AND TOPANALYSIS
TopGen and TopAnalysis are two programs made available to users that want to evaluate internet modeling algorithms like BA (Barabasi-Albert [1]) variants and FKP (Fabricant, Koutsoupias and Papadimitriou [2]). TopGen is mainly used to generate a graph and also implements some basic metrics. It supports the following models: FKP, Uniform, Probabilistic, DeGen, ProbiGen, Best Two, Independent Path, Fertile Node, AHOT – 2, Controlled Distance, Enhanced BT. [3] contains more information on the last six models. TopAnalysis is used to load an already existing graph and evaluate it using different metrics.
TopGen is written by Minas Gjoka, Foudalis Ilias and Krouska Giwta. TopAnalysis is written by Minas Gjoka. Notable libraries used are :
1) Colt, an open source library for High Performance Scientific and Technical Computing
2)
JUNG, the Java Universal Network/Graph Framework
HOW TO RUN THE PROGRAMS
Both programs use Java 1.4. Use “winrun.bat” and “linuxrun” to run the programs in Windows or UNIX/Linux accordingly.
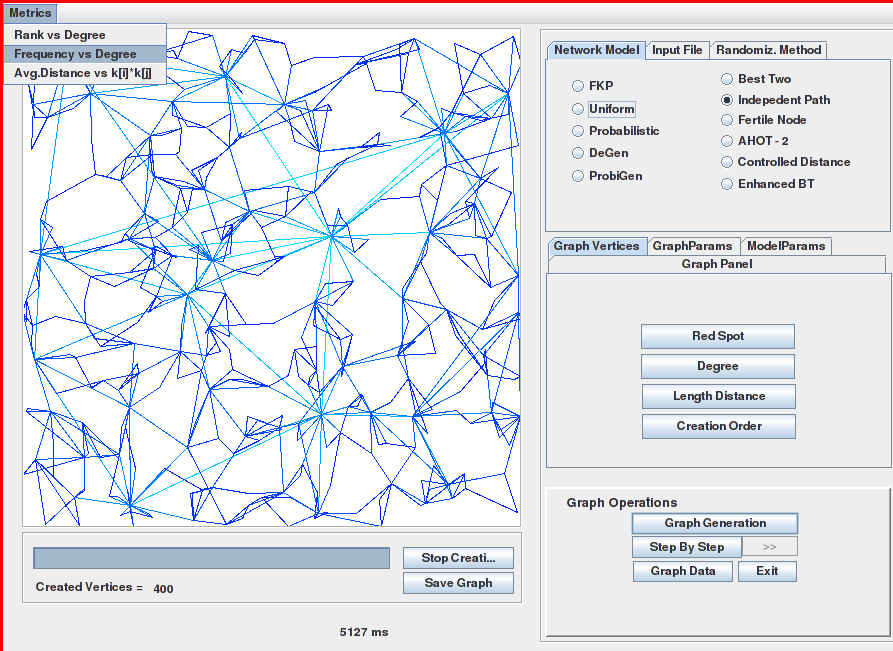
3.1 HOW TO START THE SIMULATIONS WITH TOPGEN
First, select the model that you want to use from the “Network Model” tabbed pane. Then set the models parameters at “Model Params” and “Graph Params” tabbed panes. After these steps, you can run/create your graph. You have two options. Either you can run it Step by Step (by pressing the step by step button and then the >> to go to the next step) or by pressing the graph generation button. These buttons can be found in the Graph Operations pane.
Note that if you want to run the BT model you have to set MaxEdgesPerStep = 2.
3.2 WHAT ELSE TOPGEN CAN DO
TopGen also implements some
graph metrics such as
Frequency vs.
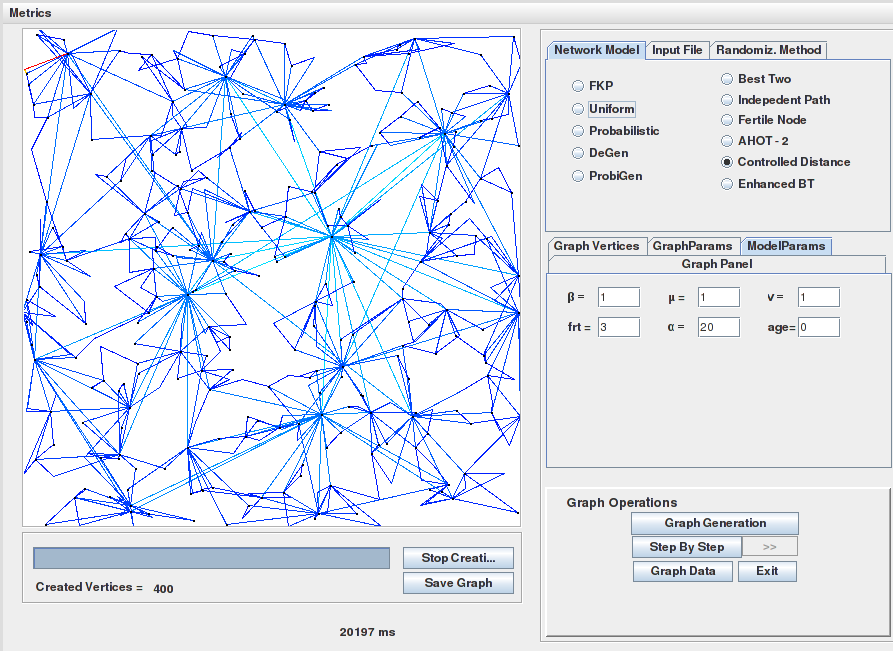
Degree and Degree vs. Rank power laws. Also for the Controlled
Distance model the Average Distance vs. Degree metric is supported.
Another very useful operation (especially, if you are planning to use
the TopAnalysis program) is the "Graph Data" button at the
"Graph Operations" pane.
There you can find an option to export
your data to a file. After that you can load the data from
TopAnalysis and analyze the graph. A useful option if you always want
to
have random graphs created is to check the “Use Randomize” box
that can be found at “Randomiz.Method” tabbed pane. It should be noted
that TopGen contains many more features not mentioned in this brief
introduction. Some screenshots from TopGen follow below

HOW TO USE TOPANALYSIS
First you have to open a graph file. The formats of the following generators are supported:
i) TopGen with extension
.topgen (see section 3.2 to see how you can save a graph file).
ii) BGP Table Dump with extension .txt
iii) Inet with extension .inet
iv) ToGenD with extension .togend
v) GDTANG with extension .gdtang
vi) Dreier wtih extension .dreir
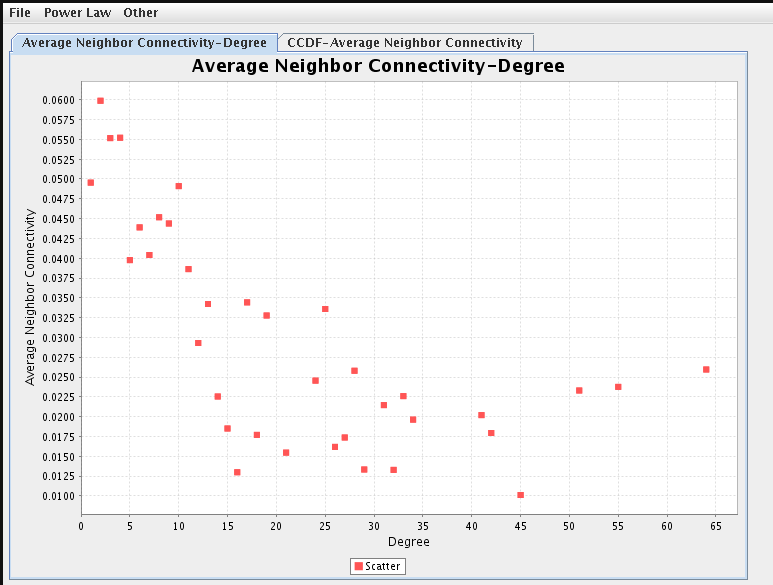
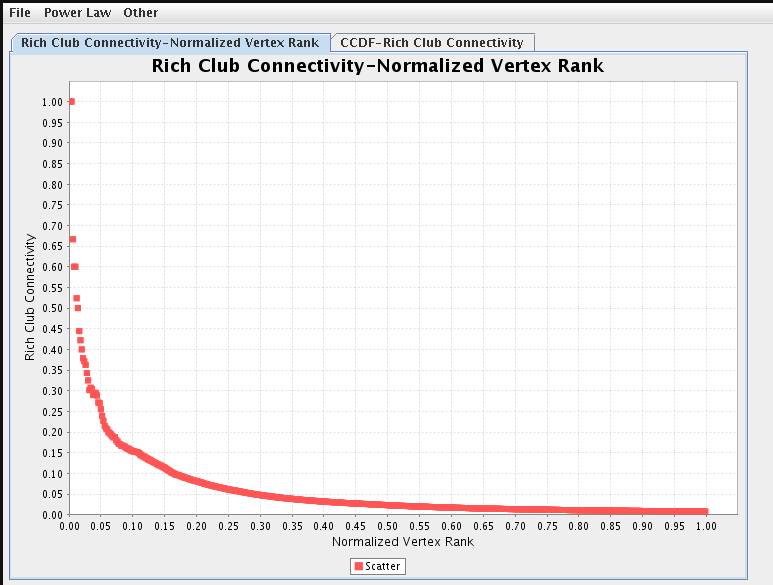
When
the graph is loaded, click on the 2 metric menus and select the
metric that you want to do.
Note that the information for the metrics may being printed in the console. Only the graphs (if they exist on the specific metric) are presented in the main program.
A list with the implemented graph metrics follows. Snapshots are included for a FKP generated topology with 500 nodes and 975 edges (or file "testinput2.topgen" inside the released TopAnalysis archive ).
a) Degree vs Rank,
Frequency vs Degree, CCDF vs Degree
Console Output:
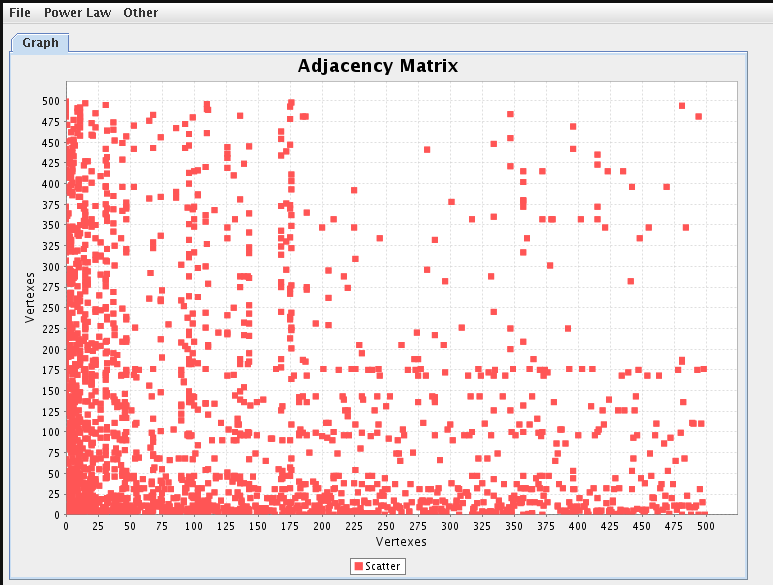
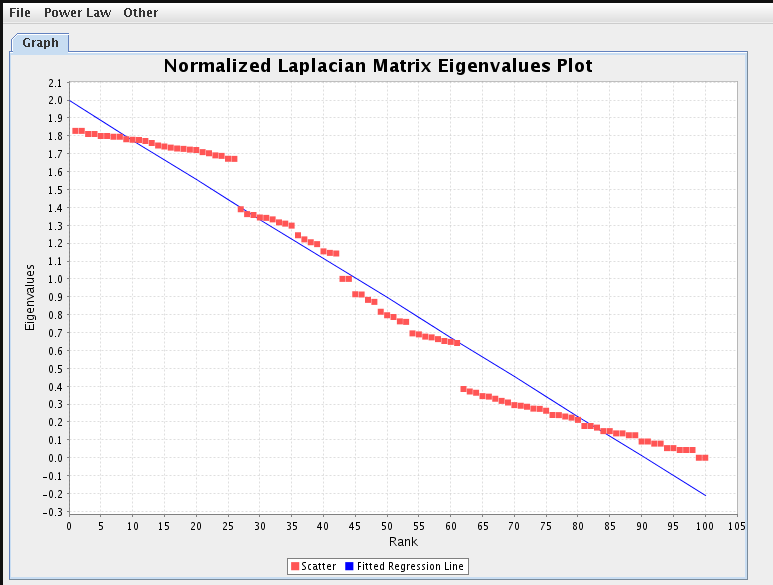
b) Adjacency Matrix
Graph and Eigenvalues
0


KNOWN BUGS
Sometimes when new tabs are opened (a metric tab) and a graph has been generated, the graphics of the graph that has been drawn “break”. Sometimes you can fix the graphics if you open/close again the tab.
References
[1] R Albert, AL Barabasi, "Topology of evolving networks: local events and universality," Physical Review Letters, volume 85, pages 5234 - 237, 2000.
[2] Alex Fabrikant, Elias Koutsoupias and Christos H. Papadimitriou, "Heuristically Optimized Trade-offs: A new paradigm for power laws in the Internet," in Proceedings of the 29th International Colloquium on Automata, Languages and Programming, 2002.
[3] Antonis Spatharis, Ilias Foudalis, Minas Gjoka, Panagiota Krouska, Christos Amanatidis, Christos H. Papadimitriou, and Martha Sideri, "Improved Tradeoff-based Models of the Internet," in Proceedings of the SIWN/IEEE International Conference on Complex Open Distributed Systems 2007.